Ocean modeling is the science of describing and predicting characteristics of the ocean, calculated from real-time data inputs and the physics of fluid dynamics. The inputs include observations from satellites, moorings, tidal gauges, high-frequency radar stations, and buoys, among other sources. This information is collected daily, hourly, or even more frequently, and fed into the model. The model itself is a computer program of interconnected parts (see Ocean Model Coupling Explained) that takes this new data, along with model estimates from its previous calculations, and applies equations of fluid physics to calculate how the conditions at a site will change over a given time period.
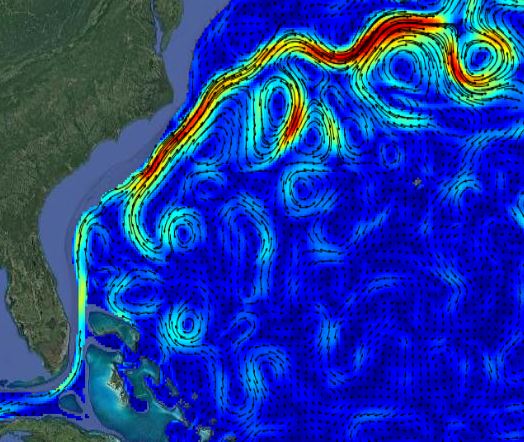
To describe the conditions of a body of water, the model fills that three-dimensional body with millions of points arrayed in a 3-D grid. It calculates the conditions at each point, based on the point’s previous conditions, observations near that point, and the amount of time elapsed from the last calculation. This process repeats thousands of times each day. All these point calculations are the model output, which can be saved at customizable time intervals and plotted. Model output can be visualized as maps showing specific features such as water temperature or significant wave height, and combined into videos.
Because Fathom Science’s models cover the three-dimensional ocean from surface to bottom, features can be examined at every depth. Ever wondered how fast the Gulf Stream current is at 500 m below the surface? Few instruments are there to measure it, but modeling gives us insight.